
Frequently Asked Questions about how to use the PROCESS templates
This FAQ PROCESS overview can hopefully help you to use my templates to graph conditional effects. They are made for the PROCESS macro from Andrew Hayes to calculate conditional effects within SPSS.
Current available PROCESS templates
- Graphing moderation (PROCESS v3.0) – Model 1 (IV on x-axis) (Windows version, with a dichotomous independent variable (X), a continuous moderator (W), and a continuous dependent variable (Y). Click here for the Mac version.
- Graphing moderation (PROCESS v3.0) – Model 1 (MOD on x-axis) (Windows version), with a dichotomous independent variable (X), a continuous moderator (W), and a continuous dependent variable (Y). Click here for the Mac version.
- Graphing moderation (PROCESS v3.0) – Model 1 (continuous IV) (Windows version), with a continous independent variable (X), a continuous dependent variable (Y), and a continuous moderator (W). As some of you requested, the IV is on the x-axis, and the moderator in the legend. Click here for the Mac version.
- Graphing moderated moderation (PROCESS v3.0) – Model 3 (Windows version), with a continuous independent variable (X) Negative Emotions, a continuous dependent variable (Y) Support for Government Action, a categorical moderator (W) Sex, and a continuous moderator (Z) Age. Click here for the Mac version.
- Graphing moderated mediation (PROCESS v3) – Model 7 (Windows version), with a dichotomous independent variable (X), and a continuous moderator (W), mediator (M) and dependent variable (Y). Click here for the Mac version.
- Graphing moderated mediation (PROCESS v3) – Model 7 (Windows version), with a continuous independent variable (X), and a continuous moderator (W), continuous mediator (M) and continuous dependent variable (Y). Click here for the Mac version.
- Graphing moderated mediation (PROCESS v2.16) – Model 8 (Windows version), with a dichotomous independent variable (X), and a continuous moderator (W), mediator (M) and dependent variable (Y). As this is based on an earlier version of PROCESS, we are discontinuing the development of this template and recommend you to use V3.
- Graphing moderated mediation (PROCESS v3) – Model 8 (Windows version), with a dichotomous independent variable (X), and a continuous moderator (W), mediator (M) and dependent variable (Y). Click here for the Mac version.
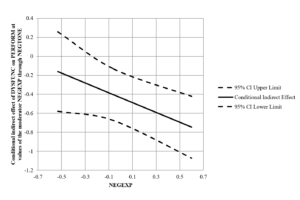
- Graphing moderated mediation (PROCESS v3.0) – Model 14 (Windows version), with a continuous independent variable (X) Dysfunctional Behavior, a continuous dependent variable (Y) Work Performance, a continuous mediator (M) Negative Affective Tone, and a continuous moderator (W) Nonverbal Negative Expressivity. Click here for the Mac version.
- Graphing moderated mediation (PROCESS v3.0) – Model 14 (Windows version), with a dichotomous independent variable (X), a continuous dependent variable (Y), a continuous mediator (M), and a continuous moderator (W). Click here for the Mac version.
- Graphing moderated mediation (PROCESS v3.0) – Model 15 (Windows version) with a continuous independent variable (X), a continuous dependent variable (Y), a continuous mediator (M) , and a continuous moderator (W).
Current PROCESS blogs
For an example how to use this template, you are welcome to read our blogs:
https://www.md2c.nl/graphing-moderation-of-process-v3-0-model-1/
https://www.md2c.nl/graphing-conditional-indirect-effects/
I am very thankful for all the great feedback and questions we are receiving from fellow-researchers, and I hope that you will continue doing this.
With this list of Frequently Asked Question, I am trying to cover most of the questions, but please don’t hesitate to reach out to me!
FAQ PROCESS Questions & Answers
FAQ PROCESS Question: I can’t see any graph, what goes wrong?
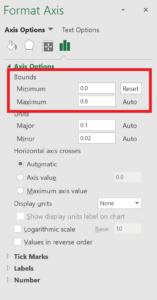
Answer: Please check first if you have “.” or “,” as a decimal separator. The templates require a “.” as decimal separator. A quick solution could be the usage of “find-and-replace” in Excel, where you replace the “,” for the “.” for the input rows. Secondly, please check the axis of the graph: sometimes you have to reset them by right-clicking on the required axis, select “Format Axis”, and reset the Minimum and/or Maximum Bounds values.
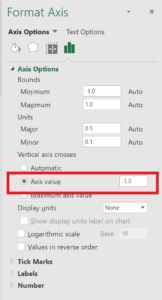
FAQ PROCESS Question: The axis are crossing the middle of the graphs (mostly at value 0), what can I do?
Answer: you can right-click on the required axis, select “Format Axis”, and set the value at which the axis crosses
FAQ PROCESS Question: There isn’t a template for my model, can you make one?
Answer: if you could contact us, and provide us the data (we won’t use it other than just for inspection and possible creation of the template), we can let you know if that is possible or not.
FAQ PROCESS Question: I haven’t received the download link, what can I do?
Answer: it could take some business days to process the paypal transfer, but sometimes, the email is in your spambox of emails are blocked. In any case: please feel free to reach out to me and I will make sure you will get your template. You can reach me by sending an email to info [at] md2c [dot] nl
FAQ PROCESS Question: I can’t download the template, what can I do?
Answer: please check your browser. The download works best with Mozilla or Edge, and does not work correctly with Chrome currently. In any case: please feel free to reach out to me and I will make sure you will get your template. You can reach me by sending an email to info [at] md2c [dot] nl