
This tutorial is about graphing a moderated mediation model with PROCESS for R, with Hayes’s PROCESS source code, and my MD2C graphing template.
Andrew Hayes developed the PROCESS macro for mediation, moderation, and conditional process analysis. He also wrote a fantastic book about it: Introduction to Mediation, Moderation and Conditional Process Analysis.
I made several Excel templates to help you graph conditional effects, but these were always based on SPSS output only.
The good news is that Hayes also developed PROCESS for R. So now you can graph your conditional effects for free! Well, that is, nearly for free, as my templates are 3.99 EUR. But if you are a student or a researcher and you can’t afford those expenses, just reach out to me!
Prerequisites
Book
First and foremost, I would recommend you to buy and read Andrew Hayes’ book Introduction to Mediation, Moderation, and Conditional Process Analysis.
PROCESS source code for R with data
You can find the source code on the Resource Hub of the Canadian Centre for Research Analysis and Methods (CCRAM). Here you can find many resources, among which there is the PROCESS macro for SPSS, SAS, and R. This zip file comes with the data as well.
R
And of course, you need R to write the code and run the PROCESS formula. You might want to install an interface as well. I us RStudio Desktop.
MD2C graphing template for model 14
At my shop you can find the MD2C graphing template for model 14 (moderated mediation).
The case: hiding your feelings from your work team
The case that Hayes uses is based on the article of M. S. Cole et al. (2008). This research is about that sometimes it might be better to hide your feelings at work when it’s about the things your colleagues say or do that disturb you. Because if you do express those feelings, it can become the center of attention, and so it could distract the team from finishing a task on time and efficiently.
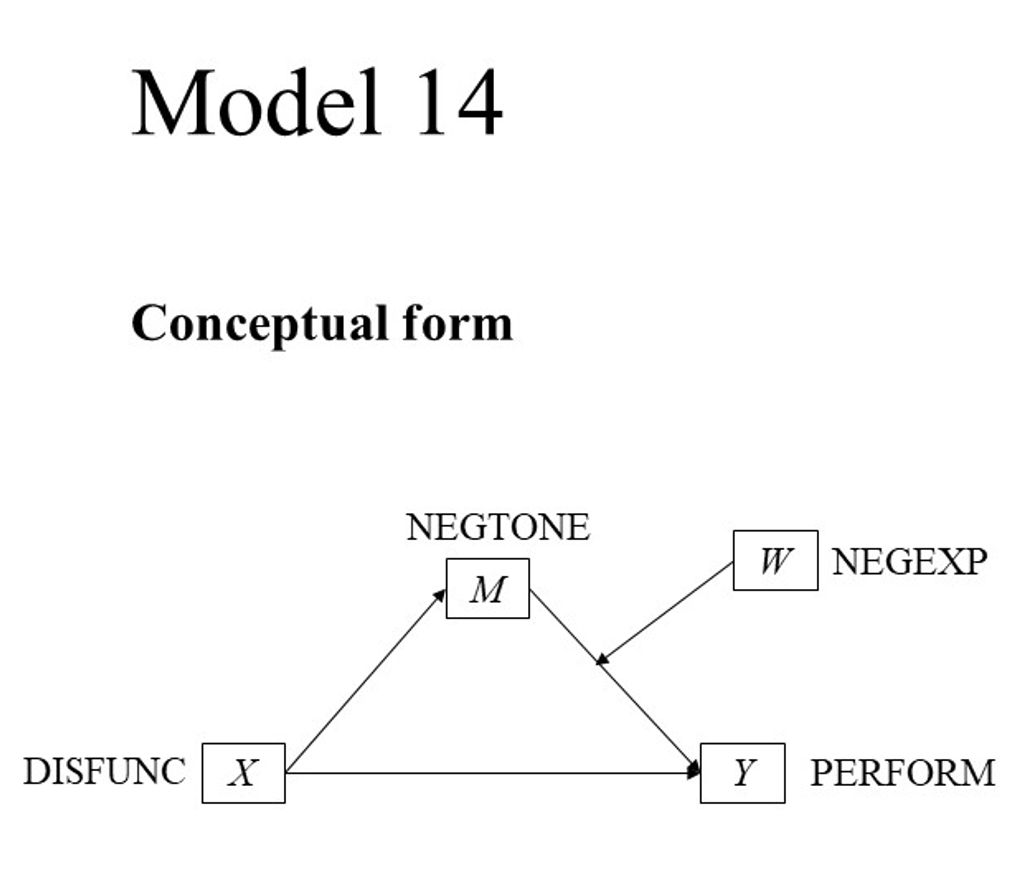
According to Hayes: “This goal of the study was to examine the mechanism by which the dysfunctional behavior of members of a work team can negatively affect the ability of a work team to perform well. They proposed a mediation model in which dysfunctional behavior (DYSFUNC) leads to a work environment filled with negative emotions (NEGTONE) that supervisors and other employees confront and attempt to manage, which then distract from work and interfere with task performance (PERFORM). However, according to their model, when team members are able to regulate their display of negative emotions (NEGEXP), essentially hiding how they are feeling from others, this allows the team to stay focused on the task at hand rather than having to shift focus toward managing the negative tone of the work environment and the feelings of others. That is, the effect of negative affective tone of the work environment on team performance is hypothesized in their model as contingent on the ability of the team members to hide their feelings from the team, with a stronger negative effect of negative affective tone on performance in teams that express their negativity rather than conceal it.”.
I would highly recommend you read the complete case study before you start coding!

In this tutorial I am purely focusing on the graphing part. If you would like to know more about the case, I would highly recommend you read the book. In fact, I strongly believe that without this book, it would be really challenging to understand what the PROCESS macro does, how to define the settings and understand the interpretation of the results. So, this does require effort, but the good news is that, in my opinion, Hayes is an excellent writer with the gift of explaining complex statistics in a nice, readable way, always accompanied by clear stories.
The code
You can find the R code for model 14 in this Github repository. In order to run the code, make sure you save the source code for PROCESS (process.R from the PROCESS macro for SPSS, SAS, and R zip file) in the same directory as the R code for model 14. You also need to store de dataset “teams.csv” in the same directory. You can find this data in the same PROCESS macro for SPSS, SAS, and R zip file.
You start with the required libraries.
# Install the required packages if needed
list.of.packages <- c("readr", "Rcpp")
new.packages <- list.of.packages[!(list.of.packages %in% installed.packages()[, "Package"])]
if (length(new.packages)) install.packages(new.packages)

# Load libraries
library(readr)
library(Rcpp)
Then you set your working directory.
# Set working directory, choose the name of your folder
PATH_TO_YOUR_WORKING_DIRECTORY <- "YOUR_PATH"
setwd(PATH_TO_YOUR_WORKING_DIRECTORY)
Now you have to source the PROCESS function. Make sure you have downloaded the code and saved it in the same directory as this script.
# Load the PROCESS macro for R, this might take a while
source("process.R")
Furthermore, we need the data. Make sure you have downloaded the data and saved it in the same directory as this script.
# read the data file TEAMS
filename <- "teams.csv"
teams <- read.csv(file=filename,head=TRUE,sep=",",na.strings=c("NA","#DIV/0!","#N/A",""))
Finally, we are able to use the PROCESS function to get the model analysis results.
## MODERATED MEDIATION ANALYSIS: Hiding your feelings from your work team
# This case uses a mediation model in which dysfunctional behavior (X=DYSFUNC)
# leads to a work environment filled with negative emotions (M=NEGTONE) that
# supervisors and other employees confront and attempt to manage, which then
# distract from work and interfere with task performance (Y=PERFORM).
# However, according to their model, when team members are able to regulate their
# display of negative emotions (W=NEGEXP), essentially hiding how they are
# feeling from others, this allows the team to stay focused on the task at hand
# rather than having to shift focus toward managing the negative tone of the
# work environment and the feelings of others.
process(data=teams,y="perform",x="dysfunc",m="negtone",w="negexp",
         model=14,plot=1,seed=42517, jn=1)
Visualizing the graphs
Wait for the function to come back with the result…and now you have everything! First, you would have to analyze the results of the model. Hayes explains every detail of this process. As we are here focusing on the visualization part, we can directly go to the output. Besides, you would need the MD2C graphing template for model 14.
Visualizing the moderation effect
In order to obtain the graph of the moderation effect, there are a 3 steps.
Step 1: Open the MD2C graphing template and enter the variables
Open the MD2C graphing template, and on the “ModerationEffect” tab, enter your variable names:

Step 2: Copy the data
The next step is to scroll down the output of the PROCESS function in R and go to the data for visualizing the conditional effect of the focal predictor part. Copy the data, without the headers:

Step 3: Paste the data
Now go back to the MD2C graphing template and paste the data (values only) in the “ModerationEffect” tab:

And there you go! Your graph is nearly ready. Please check the bound values of the x and y-axis (“format axis” in Excel), as they depend on your data. Please also check the unit steps. And this is how your graph could look like:

Visualizing the conditional effect
In order to visualize the condition effect, there are also 3 steps.
Step 1: Open the MD2C graphing template and enter the variables
Open the MD2C graphing template, and on the “ConditionalEffect” tab, enter your variable names:

Step 2: Copy the data
The next step is to scroll down the output of the PROCESS function in R and go to the Conditional effect of focal predictor at values of the moderator part. Copy the data with the headers:

Step 3: Paste the data
Now go back to the MD2C graphing template and paste the data with the header (values only) in the “ConditionalEffect” tab:

And there you go! Your graph is nearly ready. Please check the bound values of the x and y-axis (“format axis” in Excel), as they depend on your data. Please also check the unit steps. And this is how your graph could look like:

Visualizing the moderated mediation
In order to visualize the moderated mediation, there are also 3 steps.
Step 1: Open the MD2C graphing template and enter the variables
Open the MD2C graphing template, and on the “ModeratedMediation” tab, enter your variable names:

Step 2: Copy the data
The next step is to scroll down the output of the PROCESS function in R and go to the INDIRECT EFFECT part. Copy the data with the headers:

Step 3: Paste the data
Now go back to the MD2C graphing template and paste the data with the header (values only) in the “ModeratedMediation” tab:

And there you go! Your graph is nearly ready. Please check the bound values of the x and y-axis (“format axis” in Excel), as they depend on your data. Please also check the unit steps. And this is how your graph could look like:

I hope you find this tutorial useful, and I would love to hear if you have any comments or recommendations!