
This tutorial is about graphing a simple moderation model with PROCESS for R, developed by Andrew Hayes, and my MD2C graphing template. There is a Github Repository for it as well, containing the R code.
Andrew Hayes developed the PROCESS macro for mediation, moderation, and conditional process analysis. He also wrote a fantastic book about it: Introduction to Mediation, Moderation and Conditional Process Analysis.
I made several Excel templates to help you graph conditional effects, but these were always based on SPSS output only.
The good news is that Hayes also developed PROCESS for R. So now you can graph your conditional effects for free! Well, that is, nearly for free, as my templates are 3.99 EUR. But if you are a student or a researcher and you can’t afford those expenses, just reach out to me!
Prerequisites
Book
First and foremost, I would recommend you to buy and read Andrew Hayes’ book Introduction to Mediation, Moderation, and Conditional Process Analysis.
PROCESS source code for R with data
You can find the source code on the Resource Hub of the Canadian Centre for Research Analysis and Methods (CCRAM). Here you can find many resources, among which there is the PROCESS macro for SPSS, SAS, and R. This zip file comes with the data as well.
R
And of course, you need R to write the code and run the PROCESS formula. You might want to install an interface as well. I us RStudio Desktop.
MD2C graphing template for model 1
At my shop you can find the MD2C graphing template for model 1 (simple moderation).
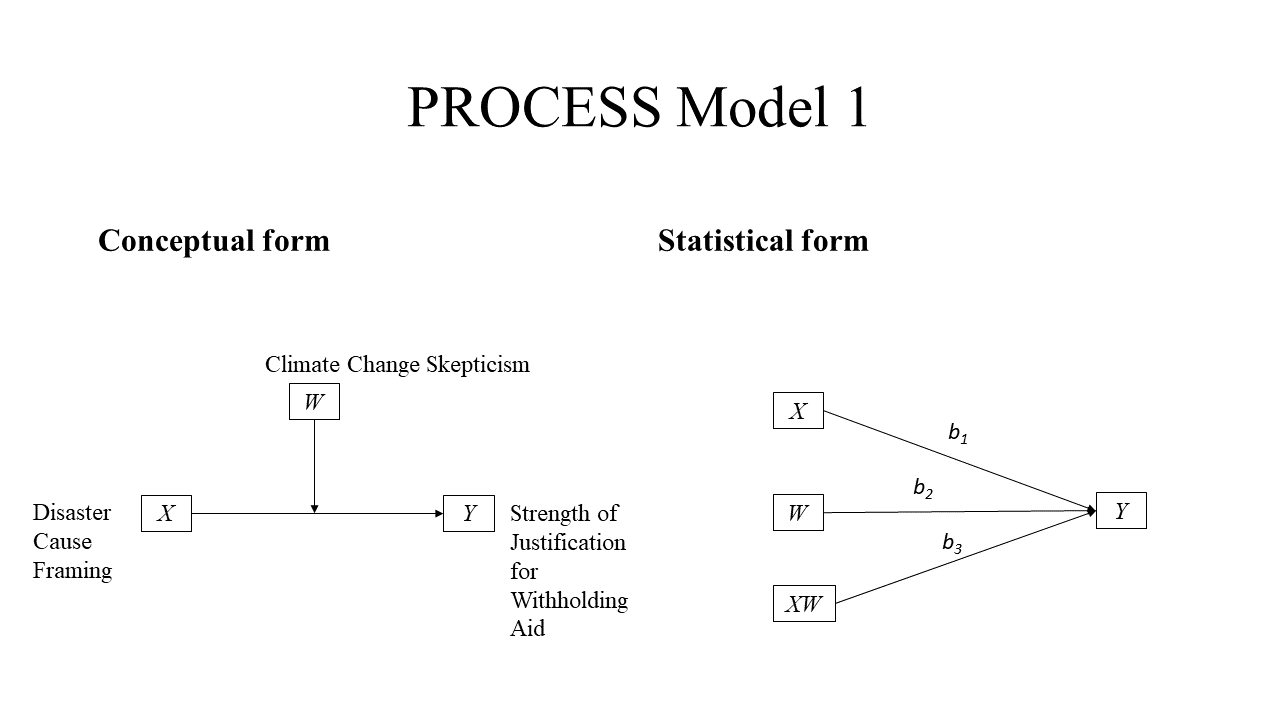
The case: climate change disasters and humanitarianism
The case that Hayes uses is based on the article of Chapman and Lickel (2016). It’s about a group of 211 people that read about famine in Africa caused by the droughts affecting the region. Half of the group got the information that climate change caused the drought, and the other half of the group did not get information about the cause of the drought. This resulted in a dichotomous variable called “FRAME”, with values 1 for those who received the climate change information, and 0 for those who didn’t get this information. After reading the article, they had to answer to what extent they agreed/disagreed to not help the victims. The score was captured in the continuous variable “JUSTIFY”, representing the strength of withholding aid to the victims. Finally, they got a question regarding their belief in climate change, resulting in the continuous variable “SKEPTIC”, representing to what extent somebody is skeptical regarding climate change.
So now we have all variables to test whether framing the disaster as caused by climate change rather than leaving the cause unspecified (FRAME) influences people’s justifications for not helping (JUSTIFY), and whether this effect of framing is dependent on a person’s skepticism about climate change (SKEPTIC).

In this tutorial I am purely focusing on the graphing part. If you would like to know more about the case, I would highly recommend you read the book. In fact, I strongly believe that without this book, it would be really challenging to understand what the PROCESS macro does, how to define the settings and understand the interpretation of the results. So, this does require effort, but the good news is that, in my opinion, Hayes is an excellent writer with the gift of explaining complex statistics in a nice, readable way, always accompanied by clear stories.
The code
You can find the R code for model 1 in this Github repository. In order to run the code, make sure you save the source code for PROCESS (process.R from the PROCESS macro for SPSS, SAS, and R zip file) in the same directory as the R code for model 1. You also need to store de dataset “disaster.csv” in the same directory. You can find this data in the same PROCESS macro for SPSS, SAS, and R zip file.
You start with the required libraries.
# Install the required packages if needed
list.of.packages <- c("readr", "Rcpp")
new.packages <- list.of.packages[!(list.of.packages %in% installed.packages()[, "Package"])]
if (length(new.packages)) install.packages(new.packages)

# Load libraries
library(readr)
library(Rcpp)
Then you set your working directory.
# Set working directory, choose the name of your folder
PATH_TO_YOUR_WORKING_DIRECTORY <- "YOUR_PATH"
setwd(PATH_TO_YOUR_WORKING_DIRECTORY)
Now you have to source the PROCESS formula. Make sure you have downloaded the code and saved it in the same directory as this script.
# Load the PROCESS macro for R, this might take a while
source("process.R")
Furthermore, we need the data. Make sure you have downloaded the data and saved it in the same directory as this script.
# read the data file DISASTER
filename <- "disaster.csv"
disaster <- read.csv(file=filename,head=TRUE,sep=",",na.strings=c("NA","#DIV/0!","#N/A",""))
Finally, we are able to use the PROCESS formula to get the model analysis results.
## MODERATION ANALYSIS: Climate Change Disasters and Humanitarianism
# The dataset contains the variables to test whether framing the disaster as caused
# by climate change rather than leaving the cause unspecified (frame) influences people’s
# justifications for not helping (justify), and whether this effect of framing
# is dependent on a person’s skepticism about climate change (skeptic).
# We also want to obtain data to plot the graphs, both the conditional effect
# of the focal predictor "frame" (plot=1) as the conditional effect of
# focal predictor "frame" at values of the moderator "skeptic" (jn=1)

process(data=disaster,y="justify",x="frame",w="skeptic",model=1,plot=1,jn=1)
Visualizing the graphs
Wait for the function to come back with the result…and now you have everything! First, you would have to analyze the results of the model. Hayes explains every detail of this process. As we are here focusing on the visualization part, we can directly go to the output. Besides, you would need the MD2C graphing template for model 1.
Visualizing the moderation effect
In order to obtain the graph of the moderation effect, there are a 3 steps.
Step 1: open the MD2C graphing template and enter the variables
Open the MD2C graphing template, and on the “ModerationEffect” tab, enter your variable names:

Step 2: copy the data
The next step is to scroll down the output of the PROCESS function in R and go to the data for visualizing the conditional effect part. Copy the data, without the headers:

Step 3: paste the data
Now go back to the MD2C graphing template and paste the data (values only) in the “ModerationEffect” tab:
And there you go! Your graph is nearly ready. Please check the bound values of the x and y-axis (“format axis” in Excel), as they depend on your data. Please also check the unit steps. And this is how your graph could look like:

Visualizing the conditional effect
In order to visualize the condition effect, there are also 3 steps.
Step 1: open the MD2C graphing template and enter the variables
Open the MD2C graphing template, and on the “ConditionalEffect” tab, enter your variable names:
Step 2: copy the data
The next step is to scroll down the output of the PROCESS function in R and go to the Conditional effect of focal predictor at values of the moderator part. Copy the data with the headers:

Step 3: paste the data
Now go back to the MD2C graphing template and paste the data with the header(values only) in the “ConditionalEffect” tab:

And there you go! Your graph is nearly ready. Please check the bound values of the x and y-axis (“format axis” in Excel), as they depend on your data. Please also check the unit steps. And this is how your graph could look like:

I hope you find this tutorial useful, and I would love to hear if you have any comments or recommendations!