
As researcher, there is a big chance that you have to create graphs. I decided to created some PROCESS Graphing templates to help you graph moderation, moderated mediation, etc., based on the output of the PROCESS macro from Andrew Hayes for SPSS.
This PROCESS macro from Andrew Hayes is very usefull to calculate conditional effects within SPSS. If you want to visualize these effects, you can use one of my PROCESS Graphing templates.
The below templates are designed for Windows OS, but I have good news for Apple OS users: the templates are now also available for Excel on Mac!
Please use Mozilla or Edge to download your templates. Currently, the download does not work with Chrome. In case you do have trouble with the download, please feel free to contact me by sending an email to info [at] md2c [dot] nl and I will make sure you will get your template.
Nowadays, prices are rising more and more. I want to keep the price of these templates as low as possiple. My goal is to help other researchers, not to make a fortune. Do you want the help me keeping this price low? Then please donate a small amount to cover the costs of the webhosting etc.
I also aim to make an annual donation to Setter Rescue Netherlands, they help many dogs to get a nice family. Every dog deserves a nice home! This year, I could contribute a little to their new car.
Available PROCESS Templates
Please find below the current available templates. If you have special requests, please reach out to me. I can’t guarantee you that I can graph every model, but I am willing to try!
Model 1
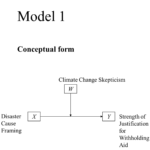
For model 1, I have 3 options, depending on your type of variables and how you want to graph the moderation effect:
- Graphing moderation (PROCESS v3.0) – Model 1 (IV on x-axis) (Windows version, with a dichotomous independent variable (X), a continuous moderator (W), and a continuous dependent variable (Y). Click here for the Mac version.
- Graphing moderation (PROCESS v3.0) – Model 1 (MOD on x-axis) (Windows version), with a dichotomous independent variable (X), a continuous moderator (W), and a continuous dependent variable (Y). Click here for the Mac version.
- Graphing moderation (PROCESS v3.0) – Model 1 (continuous IV) (Windows version), with a continous independent variable (X), a continuous dependent variable (Y), and a continuous moderator (W). As some of you requested, the IV is on the x-axis, and the moderator in the legend. Click here for the Mac version.
Model 3
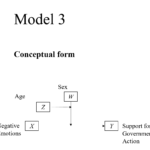
Graphing moderated moderation (PROCESS v3.0) – Model 3 (Windows version), with a continuous independent variable (X) Negative Emotions, a continuous dependent variable (Y) Support for Government Action, a categorical moderator (W) Sex, and a continuous moderator (Z) Age. Click here for the Mac version.
If you need model 3 for continuous variables, please reach out to me, so I can make a custom version for you.
Model 7
For Model 7 I have 2 options:
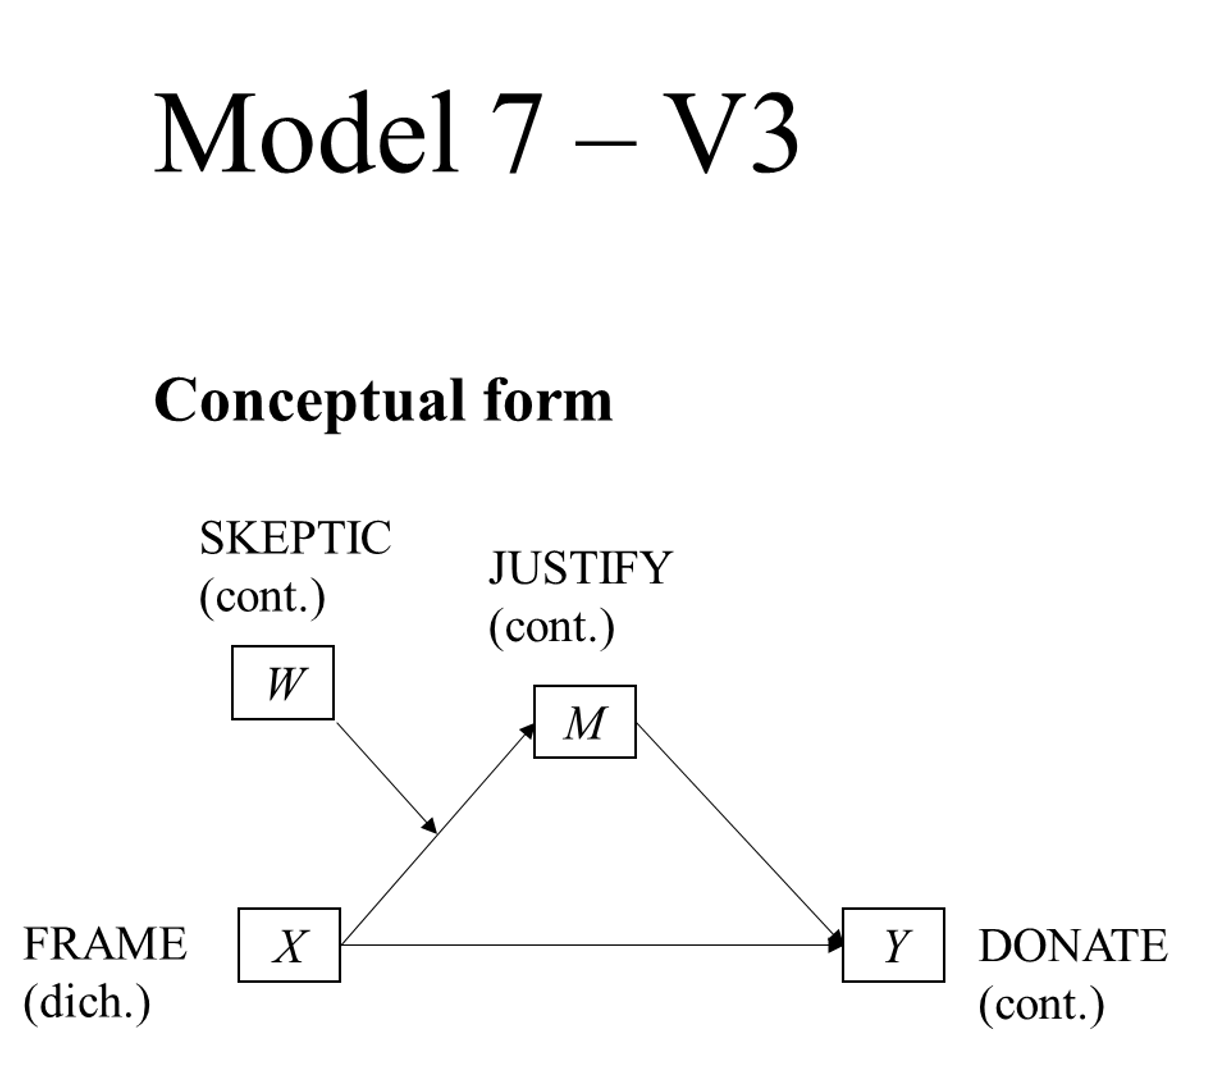
Graphing moderated mediation (PROCESS v3) – Model 7 (Windows version), with a dichotomous independent variable (X), and a continuous moderator (W), mediator (M) and dependent variable (Y). Click here for the Mac version.
Graphing moderated mediation (PROCESS v3) – Model 7 (Windows version), with a continuous independent variable (X), and a continuous moderator (W), continuous mediator (M) and continuous dependent variable (Y). Click here for the Mac version.
Model 8
For model 8 I have 2 options, but I recommend you to update PROCESS to the latest edition.
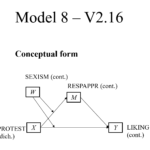
Graphing moderated mediation (PROCESS v2.16) – Model 8 (Windows version), with a dichotomous independent variable (X), and a continuous moderator (W), mediator (M) and dependent variable (Y). As this is based on an earlier version of PROCESS, I am discontinuing the development of this template and recommend you to use V3.
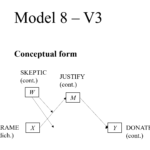
Graphing moderated mediation (PROCESS v3) – Model 8 (Windows version), with a dichotomous independent variable (X), and a continuous moderator (W), mediator (M) and dependent variable (Y). Click here for the Mac version.
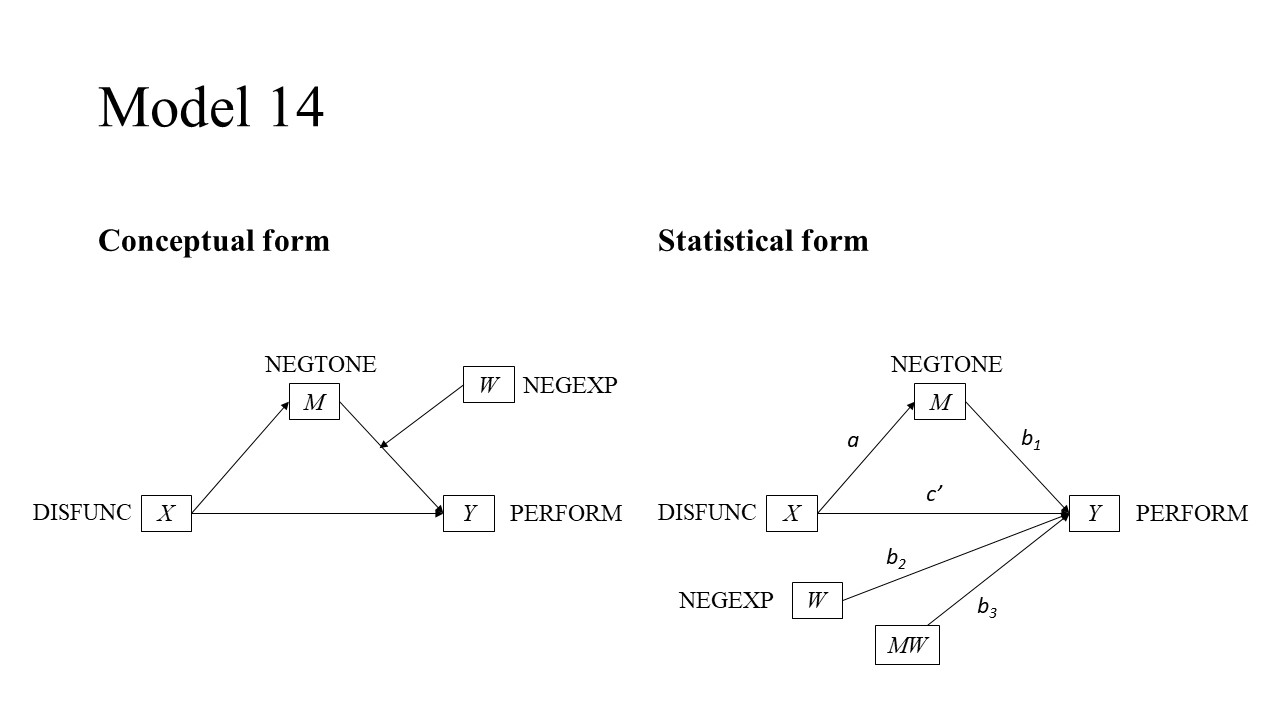
Model 14
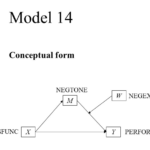
Graphing moderated mediation (PROCESS v3.0) – Model 14 (Windows version), with a continuous independent variable (X) Dysfunctional Behavior, a continuous dependent variable (Y) Work Performance, a continuous mediator (M) Negative Affective Tone, and a continuous moderator (W) Nonverbal Negative Expressivity. Click here for the Mac version.
Graphing moderated mediation (PROCESS v3.0) – Model 14 (Windows version), with a dichotomous independent variable (X), a continuous dependent variable (Y), a continuous mediator (M), and a continuous moderator (W). Click here for the Mac version.
Model 15
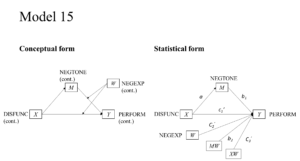
Graphing moderated mediation (PROCESS v3.0) – Model 15 (Windows version) uses a continuous independent variable (X), a continuous dependent variable (Y), a continuous mediator (M) , and a continuous moderator (W).
PROCESS Blogs
For an example how to use one of theses templates, you are welcome to read my blog about graphing a moderation model. You can find more blogs here.