This blog is about graphing moderation with the help of SPSS with the PROCESS macro, and our corresponding MD2C Graphing template for PROCESS v3.0 Model 1 – Moderation.
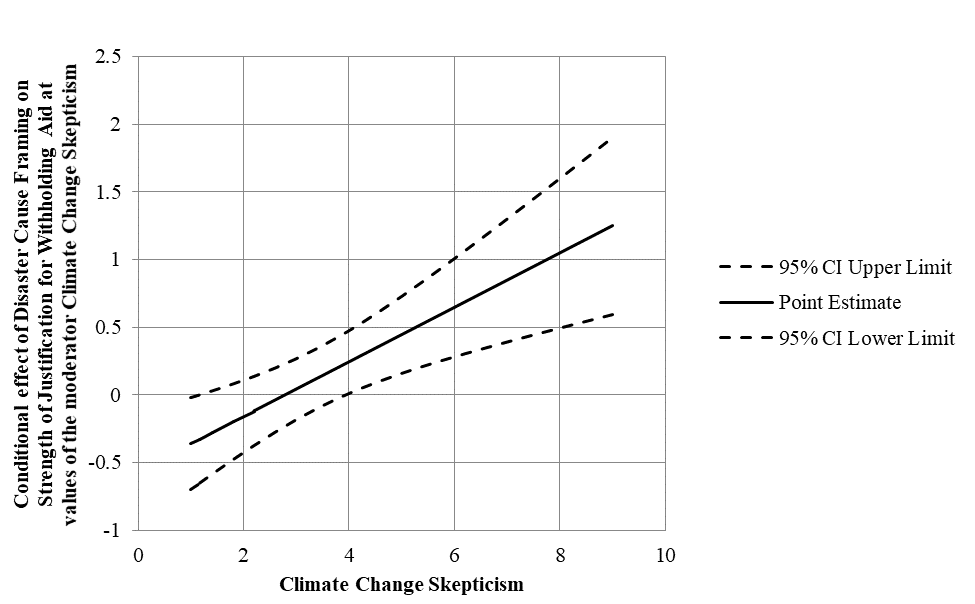
The case that we used is based on the article of Chapman and Lickel (2016), and you can find a detailed elaboration of this case in Andrew Hayes’ second book about Introduction to Mediation, Moderation, and Conditional Process Analysis (Hayes, 2017). You can download the data from Hayes’ website. The datafile you need for this example is called DISASTER. Besides, you can also download the PROCESS V3.0 macro for SPSS and SAS (and much more) from the site: http://www.processmacro.org/
Continue reading “Graphing moderation of PROCESS v3.0 Model 1”